Saturday, December 27, 2008

See a Title Tab When Report Opens

Normally, the active sheet or tab a person sees when they open a QlikView document is the sheet that was active when the document was last saved. So, the easiest way to influence which sheet a person sees when they open the document is just to be careful which sheet is active when the document is saved and closed.

You can also control which sheet or tab a person sees when they open a QlikView report with a small macro. We often do this when a report contains a title tab. The title tab contains information about the report. It would show the report title, of course, and could also show the date the data was loaded, databases used, contact info for the author or support person, security label, etc. It is also a great place for a company logo or other identifying graphics.

Step one is to build the tab you want users to see when they open the report.

Second, create a small macro (Settings->Document Properties...->Macros). For example, if the name of the title tab is Title_Tab then the macro would look like this:

Sub Activate_Title_Tab
'---------------------
ActiveDocument.Sheets("Title_Tab").Activate
End sub

Then, associate the macro with the OnOpen document event trigger and click OK.

Now you have a macro that is executed whenever the document is opened and the macro activates the tab that you want the user to see first. The Activate_Title_Tab macro is also available to be associated with a button or other events or executed by other macros when it is appropriate to switch to a particular sheet or tab.

Tuesday, December 9, 2008

QlikView Tutorial


People often come across this blog when they are searching the web for information about how to use QlikView. If you have a working copy of QlikView on your computer then you already have links to excellent information. Start up the QlikView application and look at the start page -- click Resources and you should see something like the picture on the left. Those links will take you to current information about QlikView. There's a lot of basic info but it isn't just for beginners - I never fail to find something new and useful in the QlikTech and QlikCommunity websites.


If you don't have a working copy of QlikView or can't find the start page then follow this link: Click here for QlikView Information
or follow this link to the QlikCommunity: Click here for QlikCommunity

Thursday, December 4, 2008

Variables in the .bat script


This series of blog postings about variables has probably been of interest mostly to technical folks concerned with automating QlikView documents. This one is also like that only more so. Here’s some automation wisdom that you won’t find anywhere else:

We have a set of reports where the document variables contain all the file pathnames and database access names. Loading of the reports is handled by Windows .bat scripts. We saw that the .bat scripts also needed to be able to use flexible file pathnames and database access. The variables and their values are stored in a comma-delimited file (a .csv file). The .bat scripts load their variables from the same file that the QlikView documents use to load their variables.

This is a .bat script command that will load DOS variables from a comma-delimited file:

FOR /F "skip=1 tokens=1-2 delims=," %%a IN ('type ..\Report_Control\RPT_VARS.csv') DO set %%a=%%b

That one line reads a comma-delimited text file named RPT_VARS.csv that is stored in a folder named ..\Report_Control
Skip=1 tells it to skip over the first line of the file (because it contains column titles).
The text file is simple. It looks something like this:

Variable Name,Variable Value
RPT_DBNAME,INVT_PROD
RPT_INPUT,E:\CURRENT\DATA\
RPT_OUTPUT,\\AMSERV28\PROJECTS\
RPT_LOG,C:\LOGS\BATCHLOG.TXT

Within the .bat script the variables are used between percent signs. So a line in the script might look like this:

echo %date%,%time% QV Batch started >> %RPT_LOG%


One of the reasons we stored all of the pathnames and access parameters in an external file that could be turned into variables is that it simplified the change control or promote to production process. We could develop a QlikView report and the associated scripts on a development server and then easily move the report and scripts as files to the QA server or production server without any changes. The programs would run correctly after being promoted to QA or production because they picked up the appropriate pathnames and database access variables info from the comma-delimited file stored on the new server.

We name a lot of our files with a yyyymmdd datestamp in the filename, for example “20081126_NorthRegion.dat”. It’s easy to create today’s yyyymmdd date in the .bat script as a variable with this script line:
FOR /F "tokens=1-4 delims=/- " %%A in ('date/T') do set TTDATE=%%D%%B%%C

Then it can be used in the .bat script as part of a filename like this:
COPY CURRENT.DAT %TTDATE%_NorthRegion.dat

Tuesday, December 2, 2008

Loading Variables Via Loadscript

You have two basic alternatives if you want to load document variables from a database or file. You can load them as part of the loadscript as you load data for reporting, or, you can load them through a macro script either within the QlikView document or external to the document.

In order to load variables from a database or file you must first have the variable names and the variable contents defined in the database table or in the file. The file might be a spreadsheet or text file but it must have one column or field defined for the variable names and a second column or field defined for the variable contents.

Within the QlikView loadscript you first load the variable names and contents into a QlikView table. From a database you might code it something like this:

RPT_VARS:
SQL SELECT
VAR_NAME,
VAR_VALUE
FROM REPORT_VARIABLES;

Then insert some code like this to convert the table into document variables:

Let RowCount = NumMax(NoOfRows('RPT_VARS'),0)-1;
For i=0 to '$(RowCount)'
  Let TempVarName = peek('VAR_NAME',$(i),'RPT_VARS');
  Let TempVarValue = peek('VAR_VALUE',$(i),'RPT_VARS');
  Let $(TempVarName) = '$(TempVarValue)';
  next

//If the table is no longer needed it can be dropped
Drop table RPT_VARS;

Note the NumMax function. That is necessary if the RPT_VARS table were ever empty; a null RowCount variable will cause a never-ending loop.

At work we have some reports where all of the expressions and titles and field labels are handled with variables. This allows us to use the same report at several different companies but the appearance and functionality of the report is tailored to local terminology and business practice. Another way to use this concept might allow the same report at a single company to look and work differently when it loads data from different databases that contain different sets of customized variables. So, a standard sales report could look different for the Commercial Division than it does at the Baked Goods Division.

Wednesday, November 26, 2008

Listing All Variables and Contents

[Author's note:  You can see information about a different method for accomplishing this same thing. Search on: QlikView Maven Utility That Can Extract and Show All of the Variables ]

After last weeks blog posting I got some questions about how you might list out all of the document variables and their contents. It can be a useful thing for reports that depend on variables for their functionality and useful for corporate developers who must document report functionality.

Below is a Microsoft Excel macro that could help you. When you run this macro it will ask you to select a QlikView report file and then it will copy all of the document variables and their contents into the current worksheet. Once the data is in a spreadsheet you can sort it, print it, search it for particular fields or functions, or write it out as a text or tab-delimited file. In a future blog posting I'll show how variables can be loaded into a report from a spreadsheet which, along with the macro below, will give you a method for sharing and maintaining variables.

You can get a copy of the spreadsheet with the macro installed and a button that runs the macro at this website:  [Author's note - old site is not working anymore].  The spreadsheet on the website also includes a button that will list all variables from a currently open QlikView document (sorry about the advertisements on the site - just click on the spreadsheet downloads).
Here's the Excel macro code. You can copy and paste the macro code from this window and put it into your own spreadsheet if you want to build your own.

Sub List_QV_Variables()
'This Excel macro will ask you to select a QlikView Report File and
'then it will put the variable names and contents into your current worksheet
'--Tim Benoit, Nov 2008
Dim oQV, oRpt, oVars, oTempVar, oThisVar, qv_fn

'Get the QlikView report pathname
qv_fn = Application.GetOpenFilename("QlikView Report File (.),*.*", , "Select a QlikView .qvw Report File", False)
If qv_fn = 0 Then
  Exit Sub
  End If

'Write out some heading text
ActiveSheet.Cells(1, 1).Formula = "QlikView Variables List"
ActiveSheet.Cells(2, 1).Formula = "Report pathname:"
ActiveSheet.Cells(2, 2).Formula = qv_fn
ActiveSheet.Cells(3, 1).Formula = "Variable Name"
ActiveSheet.Cells(3, 2).Formula = "Variable Content"

'Open the QlikView report file
Set oQV = CreateObject("QlikTech.QlikView")
Set oRpt = oQV.OpenDoc(qv_fn)
Set oVars = oRpt.GetVariableDescriptions
'Loop through the variables
For i = 0 To oVars.Count - 1
  Set oTempVar = oVars.Item(i)
  varname = Trim(oTempVar.Name)
  Set oThisVar = oRpt.Variables(varname)
  varcontent = oThisVar.GetRawContent
  'Write data into worksheet cells
  ActiveSheet.Cells(i + 4, 1).NumberFormat = "@"
  ActiveSheet.Cells(i + 4, 1).Formula = varname
  ActiveSheet.Cells(i + 4, 2).NumberFormat = "@"
  ActiveSheet.Cells(i + 4, 2).Formula = varcontent
  Next

'Close QlikView
oRpt.CloseDoc
oQV.Quit
End Sub

Friday, November 21, 2008

Copying Variables From One QlikView Document to Another


Today, one of the guys at work was trying to figure out how to transfer all of the document variables from one QlikView document to another. We discussed some of the things we've done in the past: loading variables and values from a spreadsheet or database either through the loadscript or through macro code. We even have an older application that stores variables in a table with loadscript code and then the document is used as a "binary" in another document's loadscript and the second document turns the table values back into variables. But, none of those options seemed to fit the requirement. One obstacle is that we could not figure out an easy way to export all of the variables and values from a document. You can export the expressions from the Expression Overview but the Variable Overview has no similar function.

With some help from Lars at Brait AB (a reader of this blog, Thanks, Lars!) who suggested a way to loop through the variables, I tested the VBScript below that can transfer variables from one document to another. I created a small text file on my laptop named "tbtest.vbs" and typed this code into it:
' /* Test Moving a variable from one QV document to another */
' /* QlikView Maven, Nov 2008 */
Option Explicit
Dim objQV, objSource, objDest, objSourceVar, objDestVar
Dim objVars, varcontent, objTempVar, varname, i

'initialize
Set objQV=CreateObject("QlikTech.QlikView")
Set objSource=objQV.OpenDoc("C:\QVfolder\Source_rpt.qvw")
Set objDest=objQV.OpenDoc("C:\QVfolder\Dest_rpt.qvw")
set objVars = objSource.GetVariableDescriptions

'Loop through the variables
for i = 0 to objVars.Count - 1
  set objTempVar = objVars.Item(i)
  varname=Trim(objTempVar.Name)
  Set objSourceVar=objSource.Variables(varname)
  varcontent=objSourceVar.GetRawContent
  'display the variable to check on progress if needed
  'msgbox(varname & " = " & varcontent)


  'update the value of variable in Destination document
  Set objDestVar=objDest.Variables(varname)

  If objDestVar is nothing then
    'must need to create variable
    objDest.CreateVariable varname
    Set objDestVar=objDest.Variables(varname)
    End If

  objDestVar.SetContent varcontent,true


next 'end of loop

'save Destination document if desired
objDest.Save

'we're done, close down
objSource.CloseDoc
objDest.CloseDoc
objQV.quit
WScript.Quit


In order to run it, I just double-clicked on the tbtest.vbs file on my desktop. You can see the pathname to the two QlikView document files in the code. This script successfully copied the variables and their values from the source to the destination document.
If you omit the part of the script that opens and updates the destination document you could turn it into a script that lists out all of the report variables and their contents -- something that is not available with the regular variable overview.

Friday, November 14, 2008

Putting a Count in the Chart Title

In my company we write a lot of QlikView reports to validate data. As part of our software projects we must check data to see that it matches assumptions and expectations. We also check the data against any other source available to validate data accuracy. Often, one of the simpler but important things on those reports is a count of things.

For example, a report might include a table box showing ITEM data. Instead of just showing the word ITEM in the table box title, we put a count of the ITEMs in the title. You can change the title on most sheet objects by right-clicking on the object and choosing Properties. The Title is in the General tab. The title might contain this:
=Num(Count(Distinct ITEM),'###,###') & ' ITEMs'

That gives us a count of the number of ITEMs that is formatted with the NUM function to use a comma as a thousands separator. The title then might show up on the chart as:
  1,220 Items

A List Box for the field named Location might contain this in the title:
=Num(Count(Distinct Location),'###,###') & ' Locations'

For another title you might want the number of sales orders in fiscal 2009. You can add an If test with a text expression like this:
=Num(Count(Distinct If(fiscal_yr='2008',order_id)),'###,###') & ' 2009 Orders'

These counts will change depending upon your current selection. The counts don't necessarily need to be in a title. The object title limits you to a single line of text. You can put the counts into a text box and that will allow you to show the information on multiple lines. If you type this into a text box:

=Num(Count(Distinct ITEM),'###,###') & ' ITEMs
' & Num(Count(Distinct Location),'###,###') & ' Locations
' & Num(Count(Distinct SDATE),'###,###') & ' Shipping Dates'


Note that the end-of-line or carriage return is part of the text. The text box will show up on the report saying something like this:
  1,220 Items
  15 Locations
  52 Shipping Dates


We have a report with a table box of SKU data where SKU ("stock-keeping unit") is a combination of item and location although the item and location fields are separate. The title for that table box contains this text expression that counts the number of occurrences of the concatenated item and location field values:
=Num(Count(Distinct ITEM&'@'&LOC),'###,###') & ' SKUs'

We often use charts with a cycle group in the dimension. That allows the report user to easily switch the chart dimensions. The current setting of the cycle group can be used in the report title if it makes sense. So, for a chart where the cycle group is named "Corp Group", you can make it a part of the chart title like this:
='Sales History by ' & GetCurrentField([Corp Group])

and then the chart title will switch between
  Sales History by Customer
  Sales History by Fiscal Month
  Sales History by Region

as the report user clicks to switch dimensions using the cycle group.

For a slightly more complex example of using the cycle group, consider a chart where the dimension is a cycle group named "Corp Group" and we want to include a count of dimension rows in the title. You could make the chart title like this:
='Sales History - ' & Num(Count(Distinct $(cg_label_1)),'###,###,###') & ' ' & GetCurrentField([Corp Group]) & 's'

You must also define a document variable named cg_label_1 that contains the name of the specific cycle group being used in the dimension. The variable would contain this text:
=GetCurrentField([Corp_Group])

now the chart title will automatically switch between text like this as the cycle group changes:
  Sales History - 4,800 Customers
  Sales History - 12 Fiscal Months
  Sales History - 6 Regions

Sunday, November 9, 2008

Set Analysis

In QlikView version 8.50 there is new functionality called Set Analysis. A "Set" as used in this functionality is similar to the already familiar concept of a QlikView Selection. This functionality allows you to define chart expressions that are calculated using something other than the current selection.

QlikView's Selection capability is already a powerful, flexible capability -- essentially a grouping of data defined any way you choose. With Set Analysis you can compare two or more of these groupings quickly and easily. In the past, this kind of functionality in a QlikView report usually required special handling in the loadscript and table structure. Now, the Set Analysis can be set up using chart expressions and existing data.

I'm sure that I will be writing again about the capabilities of this feature, so today I will only offer two examples of what can be done. These are simple to try out on a report so be sure to try them. Remember though that you will need new version 8.50. You can download the latest version of QlikView from the QlikTech or QlikCommunity websites.

Examples:

Imagine that you have a chart and one of the expressions shows historic inventory quantity. It might look like this:
Sum( qty_inv_hist )

Now, add a new expression next to that first one that will show historic inventory quantity but using the Previous Selection. "Previous Selection" is the selection you would get if you clicked on QlikView's Back button. The expression might look like this:
Sum( {$1} qty_inv_hist )

Note the curly braces that are part of this syntax. You now have a chart that compares data from the current selection to data from the previous selection. This is a very flexible feature. The previous selection might be: data from your top 5 sales regions, data from last month, data from last year, data from the Western states, data from regions where the new product has been introduced, data from products using blue labels, data from customers added in 2005, data from orders shipped by rail, etc. Get it? With little effort you can do kinds of data analysis you might never even have thought of before.

Now, add another expression that will be calculated using a selection stored inside a bookmark. This is what the expression might look like for a bookmark named "TB Item List":
Sum( { "TB Item List" } qty_inv_hist )

Quotes are required around the bookmark name because it contains spaces (you could also use square braces, [ ], instead of quotes). The idea is similar to the expression that used a previous selection except that now the selection used in this expression will be based on the bookmark selection no matter what the current selection is in the report. The bookmark can be changed at any time, of course, and some people might find this feature easier to control than the one based on a previous selection. Using a bookmark is appropriate too for a complex selection that involves making selections from several fields. The idea of a Previous Selection as in the example above works only for the most recent field where you made a selection. If the selection you want to use in the chart expression involves several fields then a bookmark is the way to go. To make this a little easier for report users, you could use a variable in the expression for the bookmark name and give the report users an input box so that they can choose the bookmark to use without opening up the chart expressions. Remember that bookmarks can be exported and shared even among dissimilar reports (Click here to read a little about sharing bookmarks).

The reference manual recommends that these set analysis features not be used on expressions that do calculations using fields from multiple QlikView tables. For example, an expression that multiplies historic inventory by a cost factor should not be used if the cost factor is from a different table within QlikView than the table where historic inventory is stored. Note that is is about where the fields are stored within the QlikView tables - it has nothing to do with the external source tables that were used for loading data. The manual says the results are "unpredictable" -- that's a good enough warning for me... it's like when the waiter says "don't order the fish" - you really will be better off if you take his advice and don't have fish for lunch.

If you are interested in the Set Analysis functionality it will be worth your time to read about it in the version 8.50 reference manual. Post a comment to this blog or send me an email if you think of something unusual or clever you can do with set analysis.

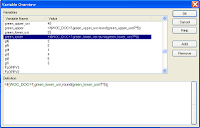
Variable Overview

I wrote about the Expression Overview in a blog posting last week (Click here to read it) so I feel I must drop the other shoe and mention the Variable Overview that is available in the same menu, Settings->Variable Overview or hold down the Ctrl+Alt+V keys at the same time for a hot-key shortcut.

The Variable Overview window shows two columns: Variable Name and Value. Click on the column headings to sort the list. Click the Add button to add a new variable. If you click on one of the variables to select it, you can remove it with the Remove button or edit the variable value in the Definition box in the bottom of the window. For a long, complex variable you can click the tall button labeled with an elipsis (". . .") to open a full-screen window for editing.

There's no way to print the contents of the window or export it to a file or search through the contents but the Variable Overview is very useful for working with reports that use a lot of variables. There is a Help button but on my copy of QlikView it doesn't sense the context and it opens to the wrong Help window.

There is a method that can be used to list out all of the document variables and their contents (Click here to read about it)

Saturday, November 1, 2008

Expression Overview


If you work with moderately complex reports then you must be working with reports with expressions. Most of the time we're concerned with expressions in chart objects (the graphs or tables with dimensions) but there can be expresssions in many places in a QlikView document. An expression might control whether a tab or chart is visible or not or it might control colors used in a chart. An expression might be used in a text object to provide customized information or a warning, or it might be used in a chart title to provide a customized title. In version 6 the only way to maintain these expressions was to remember where they are and open up each object to check on specific expressions.

In recent releases of QlikView there's a great feature called the Expression Overview. To see it, select Properties->Expression Overview (or, hold down the ctrl key, the alt key and the E key at the same time). This overview shows you where the expressions are in your document, it can show you the text of the expression, it will allow you make changes to the expression, you can search for specific text in the expressions like a field name or variable name, and you can do mass changes with the search and replace functionality.

There's no HELP button but you can make the Expression Overview Help screen appear if you press your F1 button. The Help screen will explain the available functions.

As always, if you are going to make serious changes to a document it's a good idea to make a backup copy of the document first, just in case you make a mistake and want to restore the document back the way it was.

My own preference, when I want to search for a particular kind of expression or if I just want to review all of the expressions in a report looking for problems and opportunities is to use the Export button to export all of the Expression Overview data. A box will appear asking for the pathname to use for the exported text file. The text file is a tab-delimited text file that can be reviewed with Notepad or Wordpad or a spreadsheet (or loaded into QlikView!).

The exported Expression Overview text file makes an excellent addition to documentation for a complex report for those of you who are required to produce documentation.

Note that expressions from hidden charts and other hidden objects are not included in the Expression Overview. This can be a good way to intentionally limit some of the expressions shown if you can hide specific objects. For myself, before I use the Expression Overview, I usually go to Document Properties, Security tab, and temporarily click on Show All Sheets and Objects. That way I get an overview list of every expression in the document.

Friday, October 3, 2008

Expression Knows Which Cycle Group Field is Active

Someday you may have a chart like this: there's a cycle group in the chart dimension and all of the expressions work great except that one expression needs to work differently when one particular field of the cycle group is active. Here's an example-- your chart for current month sales is working ok but the expression for allocated sales revenue must work differently when the cycle group field Division is used. Maybe the accounting department has decreed that a complex, ever changing formula must be used to show allocated sales revenue by Division so your report needs simply to show 'Not Defined' in the allocated sales revenue column when Division is used for the dimension.
You can write the expression something like this:
If(GetCurrentField(CorpCycle)='Division','Not Defined',Sum(alloc_sales))

In this example, CorpCycle is the name of the cycle group. Division is the name of the cycle group field. Use the actual field name not the label that might be used in the chart. If you're not familiar with using a cycle group in the chart dimension then it will be worth your time to find the reference manual or tutorial and read about it. Being able to change the chart dimension instantly with a mouse click is a powerful feature.

If you build your expressions using the wizard available on the Edit Expression window, you will find the GetCurrentField function along with several other interesting functions listed under System Functions.
Another common place to use this function is in the chart title. For example, you might use this for a chart title:
='CURRENT MONTH SALES SUMMARY BY ' & GetCurrentField(CorpCycle)
That will use the currently active field name from the cycle group in the chart title. As a user clicks on the cycle group the chart title will automatically change along with the dimension.

Saturday, September 27, 2008

Step Through Field Values

Author's Note: Although this technique is still sometimes very useful, there is an easier way to accomplish this in QlikView without a macro (Click here to read it).

Often, when we're analyzing data we need to examine the tables and graphs on our QlikView report for each value of a field. For example, we might need to check on inventory values and forecast error separately for each warehouse location or maybe for each product category or maybe we need to look at the data separately for each month of the year. Here's something that helps with that process. Add a button to your report and name the button "Step Through Field Values". Then, add this macro to the module and associate it with the button:
SUB StepThroughValues
'--------------------
'Step through all the available values for a field
'selecting each value one at a time
fieldName=trim(inputbox("Enter a field to cycle through. (Case sensitive and spelling counts!)","Step Through Values","Material"))
If fieldName="" then
Exit sub
End if
Set val=ActiveDocument.Fields(fieldName).GetPossibleValues(20000)
'Set val=activedocument.Fields(fieldName).GetSelectedValues(20000)
For i=0 to val.Count-1
ActiveDocument.Fields(fieldName).Select val.Item(i).Text
returnval=msgbox(val.Item(i).Text&chr(13) & i+1 & " of " &val.Count & chr(13 )& chr(13)& "Click:" & chr(13) & " YES: to create Bookmark" & chr(13) & " NO: to move to next entry" & chr(13) & " CANCEL: to quit", 259, "Step Through Values")
if returnval=2 then
Exit For
ElseIf returnval=6 then
bmarkName=inputbox("Enter a Bookmark Name", "User Entry", "BookMark " & i+1 & ", " & fieldName & "=" & val.Item(i).Text)
ActiveDocument.CreateDocBookmark false, bmarkName
End if
Next
Activedocument.Fields(fieldName).Clear
Set val=Nothing
End sub


I know that this blog format and your browser will be wrapping some of the lines in the macro and removing the indentation that I use to indicate code structure so be careful. You should be able to select and copy the code from your browser window and then paste it into the QlikView macro.

When you click the button on your report a window will appear that asks you for the name of the field to step through. Use the actual field name that was loaded into QlikView. This is case sensitive and must be the correct field name spelling. The macro will then select the first available value for the field and offer you the opportunity to create a bookmark for it. Click on No to make the macro move on and select the next possible value for the field. The bookmark is just to help you come back later and do further analysis. The macro could also be coded to write out a chart as a file or save a graph or do some other useful thing.

Note that there's a commented out line in the macro that will make it step through each of the currently selected values for a field. If you prefer that functionality, just uncomment that line and comment out the previous line to make the button step through the selected values instead of all possible values. In either case, by the time you are finished with the button it will have worked with selections for the field so you may have to restore your original selections (or use the Back arrow to move back through selections).

I hope you find the button useful. Please add a comment to this posting if you have any improvements or suggestions.

Monday, September 22, 2008

Loading All of the Files from a Folder

It's pretty easy to load all of the files from a folder into QlikView. For example, if you have a number of Excel spreadsheets in the f:\Finance\monthly_summaries folder and each spreadsheet contains a tab named EOM_SHEET and the column names on that tab are consistent in each spreadsheet file then these lines in your loadscript will load all of the spreadsheets into your QlikView report:

Directory f:\Finance\monthly_summaries;
For each ExcelFile in filelist ('*.xls')
EOM_HISTORY:

Load * From $(ExcelFile) (biff, embedded labels, table is [EOM_SHEET$]);
Next ExcelFile;


Note that this looping through the files of the folder will only use filenames that end with a .xls extension. So, any other documentation or data files in the folder will be ignored. The spreadsheets can contain other worksheet tabs too -- only the worksheet tab named EOM_SHEET will be loaded into QlikView. Hundreds of spreadsheet files can be loaded fairly quickly this way. As always with QlikView object names spelling counts and it's case-sensitive, e.g. EOM_SHEET is not the same thing as EOM_Sheet. If you're worried that not all of the spreadsheets use the same column headings then it might be best to code each column heading as a specific field name in the Load statement. That will make QlikView call it an error if the column headings in any of the spreadsheets don't match the expected field names. The error is usually better than loading inconsistent data. The Directory statement and Load statement can also make use of variables to make them more flexible to handle folder and file naming conventions. The load statement, of course, can be made to fit most situations with Where clauses and Group by options.

- - - - - - - - - - - - - - - - - - - - - - - - - - - - - - - - - - -
In a comment, Guido correctly pointed out that this syntax achieves the same result and it's simpler:
EOM_HISTORY:
Load * From f:\Finance\monthly_summaries\*.xls (biff, embedded labels, table is [EOM_SHEET$]);

Check out the other comments to this posting.

Saturday, September 20, 2008

Fixing the Field Name in an Exported Bookmark File

Last month, I wrote about how useful bookmarks are because they can be exported as a file and then imported into different QlikView reports (Click here to read it). A problem you might run into from time to time is trying to use a bookmark file where the field name in the original report is different from the field name in the report where you want to import the bookmark. It's the same data but perhaps the field name in the original report was spelled differently. This kind of thing happens all the time when data is loaded into QlikView from spreadsheets. You can edit the bookmark file to fix that problem.

Here's an example:
Imagine that your co-worker, Kavya, in the Finance department has a QlikView report with all of the sales districts selected that will be used for the new product rollout. You could really use that bookmark for your project. She makes a bookmark of the selection and exports it and emails you the bookmark file, named Rollout_districts.qbm. But, after you import the file and click the bookmark name and nothing is selected, you discover that Kavya named the field in her report sls_district and in your report it is named Sales_Districts. If either Kavya's report or your report could easily be reloaded then you might be able to fix the field name during the reload - OR - you can quickly edit the field name in the bookmark file and make it usable.
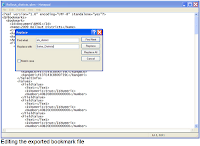
Find the file (in this example, Rollout_districts.qbm) in Windows Explorer. Right-click on the file and select Open With->Notepad. The bookmark file is a kind of text data known as XML. It's ok if you never heard of XML; you don't need to know anything about it for this process. In the Notepad window select Edit->Replace... and when the Replace window opens type sls_district in the Find What: field box and type Sales_Districts in the Replace With: box (*See the diagram at the top of this posting - click on it for a better view). Now, click the Replace All button and then click Cancel to close the Replace window. Click File->Save As and save the bookmark file under a different name (just in case you need the original file again). Don't edit or change anything else in the bookmark file. Finally, import the new bookmark file into your report and you'll have the selections just as you wanted.

For this process to work the way you want, of course, it must be the same kind of data in the fields in both the original report and the report being edited. You can't change a bookmark file of country names into a bookmark for movie titles just by editing the field name.

Saturday, September 13, 2008

Automatic Concatenation Watch-Out

This is a mistake I make every once in a while and it always puzzles me for a few minutes before I figure out what happened. In the loadscript, if you load data from several sources and use exactly the same field names then QlikView will automatically concatenate the data from the second source onto the table created for the first source. It does this unless you specify the keyword NOCONCATENATE.

Here's an example: Imagine that your loadscript loads data from a customer master table and following that you write two load statements to create a small table of just the Club customers and a second table of just the Military customers. Maybe you intend to use the small tables in a Where Exists statement further down in the script. You might write the loadscript statements like this:

CLUB_CUSTOMERS:
Load customer_no
Resident CUSTOMER_MASTER
Where customer_type = 'CLUB';
MILITARY_CUSTOMERS:
Load customer_no
Resident CUSTOMER_MASTER
Where customer_type = 'MILITARY';

That's not going to work the way you intended. There's no error or warning but after the loading you'll discover that there is no MILITARY_CUSTOMERS table. What happened is that QlikView concatenated the customer_no values from the second load statement onto the CLUB_CUSTOMERS table. It did that because the field names in the second table are exactly the same as the field names from the first table. It will do this even if the two load statements are not one after the other like in my example but even if there are other loadscript statements in between. The automatic concatenation feature is probably useful in quickly assembled loadscripts but it can cause trouble for more complex applications. You could change the field name in the MILITARY_CUSTOMERS table to be different, like customer_no_military and the automatic concatenation won't happen. OR, and this is my preference, add the NOCONCATENATE keyword to the second load statement like this:

MILITARY_CUSTOMERS:
Noconcatenate Load customer_no
Resident CUSTOMER_MASTER
Where customer_type = 'MILITARY';

Then you will end up with the two small tables that you intended.

Another keyword, CONCATENATE, is sometimes useful when you want to load two sets of data where the fields are not exactly the same into the same table. When you use this one though it will concatenate the data being loaded to the previous table in the loadscript.

Thursday, September 11, 2008

Reducing Report Size

In the previous posting I showed how a table in an existing report could be changed to make the table smaller (Click here to read it). In a comment to that posting, Rob Wunderlich correctly points out that a much simpler way to make the report smaller is to select the data you are interested in retaining and then, from the menu, select File->Reduce Data->Keep Possible Values. Then save the report under a different name in case you ever want to refer to the original. Thanks for the comment, Rob. That technique is great for permanently removing data from a report for any reason, not just to make the report smaller (e.g. removing old data, sensitive, irrelevant, unneeded, or erroneous data).

The method shown in the previous posting for changing a table in an existing report is still useful for changing field values, adding or joining new fields, etc. Someday I'll have to edit that posting to a more relevant example.

Tuesday, September 9, 2008

Change a Table Without Reloading Report


Last month I wrote a posting about interesting things you can do in the loadscript with a Partial Reload. Here's another:

I had a large report that we needed as an example for a presentation but it was just too large. The original database it loaded from is no longer available, so I needed a way to make the report smaller without reloading it. It had one large shipment data table in it and I decided to change the the table to only include two shipping location codes which would make it much smaller.

See the picture above (click it for a better view). I inserted this code at the top of the loadscript:

/* Example loadscript fragment to adjust a table */
/* Put this code at the top of the loadscript and */
/* then run a Partial Reload. */
/* Remove this fragment after using it. */

//Rename the table we want to change
RENAME TABLE HIST TO HISTX;

//Rebuild table with a WHERE clause
HIST:
ADD NOCONCATENATE LOAD * RESIDENT HISTX
WHERE (LOC='001099') or (LOC='011098');

// Drop the original table
DROP TABLE HISTX;

//so that we don't fall into the regular loadscript
EXIT SCRIPT;


Then, I saved the report file under a different name (just in case) and ran a Partial Reload. The Partial Reload executed the commands at the top of the loadscript without removing all of the other data and made the report file a lot smaller and the memory or RAM requirement for the report smaller too. Unless you know that you'll never need to reload the report again you should remove the loadscript lines you added at the top.

Don't forget the ADD or the NOCONCATENATE keywords or you'll find that the table you wanted to rebuild is missing after you run the Partial Reload.

Saturday, September 6, 2008

Checking for Loadscript Errors from the Macro code

If you are using the macro code Reload method to load data into your QlikView report you can also easily check for any loading errors. Here's an example of how that could be done. Add a small subroutine to the macro code that can check the system variable for error count like this:

Sub Check_for_errors()
'---------------------
'See if any load script errors occurred and report them
alarm_flag = 0
Set objvar = ActiveDocument.Variables("ScriptErrorCount")
If trim(objvar.GetContent.String) = "0" then
  'No error - hooray
  Exit Sub
  End If
alarm_flag = 1
'Here you can add any other error notification
End Sub

And then, in the subroutine that reloads the document code add an IF statement after the .Reload method something like this:

ActiveDocument.Reload
Check_for_errors 'call Check_for_errors subroutine
If alarm_flag = 1 then 'an error happened in the loadscript
  ActiveDocument.CloseDoc
  ActiveDocument.GetApplication.Quit
  '***Exit Function or Exit Sub
  End If

In the reports I've developed there is error checking every step of the way and any error causes a notification file to be written out. If you have an email client program on the computer where the report is reloading then consider using an email notification to the report users or to a technical support person. I've sometimes sent a small notification email message to my cell phone (My favorite message is "Lassie, go for help!") so that I can be notified immediately with the bad news.

Thursday, September 4, 2008

Checking for errors when a report reloads automatically


In a recent posting (Click here to read it) we discussed ways to run QlikView from the command line as part of an automated script process. If you run the reload process automatically then you're faced with an issue: what should happen if an error occurs during the reload? Even a report that has reloaded successfully dozens of times before can run into an error if a file is missing or the database is down or if someone changed the title on a spreadsheet column (that's the one I seem to trip over most often).
If you're going to sit at your desk in front of the computer and watch it run then you don't have to do anything -- any loadscript error window that opens up can be clicked and the report can be cancelled if necessary. But, if the report is going to load unattended without anyone watching then consider these actions:

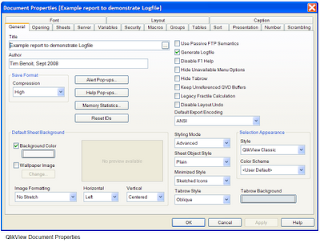
Check the Generate Logfile box on the General tab of the Document Properties window (select Settings->Document Properties from the menu - see the picture above). This is often a good idea whether you are reloading the report automatically or not. It causes QlikView to generate a text file audit trail of what happens as the loadscript runs. It captures the number of rows returned from queries and which branch an IF statement takes, it shows the expanded value of document variables that are used in commands and expressions and it shows the date and time for each command which allows you to analyze the slow-running parts of the loadscript. The logfile will be named just like the report file but with a ".log" added to the end. For example, if your report file is named Prior_Yr_Sales.qvw then the log file will be named Prior_Yr_Sales.qvw.log and it will be stored in the same folder as the report file. Open the log file with Windows Notepad or Wordpad. You can search for errors in the log file by using the Notepad or Wordpad Search function and search for Error:

For a report that must reload unattended (with no human folk watching) add this line to the top of your loadscript:
  SET ErrorMode=0;
That will tell QlikView not to open a loadscript error window when an error occurs (which would wait for someone to click OK). Instead the loadscript will go through all of the commands and do the best it can to execute all of them.

From your .bat or .cmd script you can have the script search for any lines containing the text Error: and perform an action if it is found. Here's an example:
rem Initialize the log file with xxx
echo xxx > c:\RPTS\Inventory.qvw.log
rem Now, run QlikView and reload
"c:\Program\QV.exe" /r /vbatch_flag=1 c:\RPTS\Inventory.qvw
rem Look through the log file and write
rem a note to Joe if we find an error
Type c:\RPTS\Inventory.qvw.log Find /c "Error:"
If errorlevel 1 echo %date% %time% "Error occurred" >> c:\Notify_Joe.txt

Sunday, August 31, 2008

QlikView Command Line and Automation

This posting is for the more technically inclined among you and developers who work with reports that must reload automatically.

You can run QlikView from the command line. You've probably created shortcuts on your desktop to various useful QV reports. In that kind of shortcut the command is simply the complete pathname to the report file. That will also work in a .bat or .cmd file; just enter a usable pathname to the report file and Windows will open QlikView for the report.
More interesting things can be done with a command that includes the pathname to the QlikView program followed by a pathname to the report file. This command line syntax allows you to enter switches or parameters. The command line syntax is covered pretty well in the reference manual. For example: If the pathname to your QlikView program is c:\Program Files\QlikView\QV.exe and the report you want to open is c:\reports\Inventory.qvw then this line will do a simple open of the report in a shortcut or .bat or .cmd file:
"c:\Program Files\QlikView\QV.exe" c:\reports\Inventory.qvw

You may or may not need the quotes around the pathname for QV.exe or for your report file. Windows usually wants to have the quotes for any pathname containing a blank or special character.

If you add a /r switch (notice the front-leaning slash) then the command will open the report, run the reload function (executing the loadscript), and then save and close the report:
"c:\Program Files\QlikView\QV.exe" /r c:\reports\Inventory.qvw

A /rp will do something similar except it runs the partial reload function.

The /l switch (that's a lower case ell) will open the report, run the reload function and leave the report open. This one can be useful as a desktop shortcut:
"c:\Program Files\QlikView\QV.exe" /r c:\reports\Inventory.qvw

A /p switch will open the report, run a partial reload and then leave the report open.

The /v switch can be used to pass a document variable value into the report. It can be used either with or without the switches described above. The document variable might be used in macro module code or in the loadscript. In our example if we want to reload the QV report and pass in the document variable batch_flag with a value of 1 then we'd use a command like this:
"c:\Program Files\QlikView\QV.exe" /r /vbatch_flag=1 c:\reports\Inventory.qvw

[The previous line and all of the previous command line examples are intended to be a single line even if your browser is breaking them into two lines]

We often use a command like that for reports that work differently when they are executed in batch versus being opened by a user.

My personal favorite way to use the command line syntax is from a VBScript file (.vbs script) on the Windows PC. VBScript allows me more flexibility in automatically figuring out which report file to run and what kind of document variable values should be passed in. From the VBScript file the syntax might look something like this: (using the same example)
Set objShell = CreateObject("WScript.Shell")
objShell.Run """c:\Program Files\QlikView\QV.exe"" /r /vbatch_flag=1 c:\reports\Inventory.qvw"


[Set objshell... is a single line and objShell.Run... is the second line no matter how your browser is breaking them up]

In addition to filenames using drive letters you can use network file names like this: \\canserver\projects\reports\Inventory.qvw

Thursday, August 28, 2008

VBScript in Loadscript and Module

The language used in both the QlikView loadscript and in the module code (macros) is modified VBScript. You can easily find information about VBScript commands and syntax through Google. For example, to find information about msgbox prompts and syntax enter this in Google:
vbscript tutorial msgbox

Tuesday, August 26, 2008

The best thing about Bookmarks

Many QlikView users don't make much use of the Bookmark feature. The Bookmark feature lets you save your current selections and give it a name so that you can easily recreate those selections later.

I have found the most useful part of bookmarks is that they can be exported as a little file. Then the little file can be imported back in to the report tomorrow or it can be imported into a different report. We have quite a few reports that include the field name, ITEM, which is a product identifier. Quite often, I have a selection of several ITEM values from one report that I'd like to see as a selection in a different report. I can just make a bookmark, export the bookmark, and then import the bookmark file into a different report and have those same ITEM values selected. If there are any field selections from the first report that don't make sense in the second report because the fields so not exist they are just ignored.

Sometimes a co-worker will send me a spreadsheet of data that requires further analysis. I can quickly import that spreadsheet into a new temporary QlikView report, select the ITEM values to be investigated, make a bookmark and export it. Now, I can import that bookmark file into one of our comprehensive QlikView reports and review data for the ITEM values from the spreadsheet.

Sunday, August 24, 2008

Copying a Chart From One Report to Another

Sometimes you want to copy a sheet object from one QlikView report to another. You might have two reports; say one for the finance department and a separate report for the supply chain department that both load similar data from the database. If the supply chain analyst develops a really great chart for the supply chain report and the people in finance could use it then you could copy the chart from the supply chain report to the finance report. You could always just recreate the chart from scratch on the new report of course, but it is easy to copy the chart from one report to another using Windows clipboard. Here’s how it could be done using our example:
  • Open both reports

  • Make a back-up copy of the "finance report" (the one you are going to change) by doing a save-as under a different name

  • Now, go to the supply chain report that has the cool chart. You could use the Window menu to select the other report. Click on the chart so that the chart is selected (when the chart is selected the title bar at the top of the chart changes color).

  • Select Edit->Copy from the menu

  • Switch over to the report you are going to change, the "finance report" in this example. Make sure you are looking at the finance report and select the tab where you want the chart to appear

  • Select Edit->Paste from the menu and the cool chart will get pasted into the finance report. It will appear in approximately the same position on the sheet that it occupied on the original report.

  • Finish up by moving the chart to the position you want, make any required changes to chart properties (like data field names or title, etc.) and save the changed report

You can use this method to past a sheet object into several different reports or paste the same sheet object into multiple tabs on the same report. I use this method all the time when developing a new report with multiple tabs.

Another method that can be used to copy a chart within a single report is to click on the chart, select Properties, and then select Clone. A copy of the chart will appear just slightly offset from the original one. You can use your mouse to drag the cloned chart either to a new position on the same tab or drag it to one of the other tabs at the top of the report and, when you see the curved arrow appear, release the mouse button and the chart will now be on the other tab.

Saturday, August 23, 2008

Field names and compressing data

One of the cool things about QlikView is the way it can store enormous amounts of data in the report file. It can load many millions of rows of data into a report file that might only be one or two MB in size. It compresses data so well that I seldom zip a report file before sharing it since the data is stored so densely in the QV report that zipping the file doesn't give much of a savings. If you are working with loading very large tables into a report be aware that part of the QV strategy for compressing data depends on not actually storing duplicate values in a field. If the report loads sales order data, for example, and the data contains customer name then there may be many duplicate values in the data for any customer who has ordered many times. QV will only store the customer name once and then keep track of where that customer name is used again as subsequent rows are loaded.

This mechanism means that if you load two different tables from your database that contain customer name into two different QV tables and if the field name is the same for both QV tables then each customer name value is only stored once. But, if you give the field a different name in each QV table then the program cannot know that it is the same data and it must treat each field separately and many customer name values will be stored twice. This is really only a consideration when working with enormous tables where the sheer size of the tables is affecting memory utilization of the report or the size of the report file.

Remember that QV relates or joins the tables together based on the fields they have in common. Two QV tables that both contain the field Customer_Name will be related based on that field. So, sometimes making the field names in the tables the same to be more efficient with memory utilization will not be possible if it causes two tables to be joined when they shouldn’t (the joining of tables also consumes memory space). And the field names should only be the same if the field data is truly the same. Customer number from your company’s database is not the same as customer number from another company’s database. But, customer number from your company’s 2006 sales data is probably the same as customer number from the 2007 sales data.

Thursday, August 21, 2008

Changing Daily Data to Weekly in a Chart


I got a call earlier today from an analyst who had a QlikView report loaded with detailed shipment data. The main chart on the report showed shipment totals by day but the analyst needed the chart to show weekly quantities -- "is there a way to make it show the weekly data?"

"Well, you're in luck. Not only can it be done but you can do it yourself in a few minutes." Follow these steps:
  • Open the QlikView report and save a copy of your report under a different name by selecting File->Save As from the menu (just in case I give you bogus instructions that don't work... it happens).

  • Right-click on the chart that shows the daily data. Select Properties and select the Dimensions tab. It might look like the diagram above. [Click on that diagram to make it bigger and get a better view]

  • You'll see a SHIPDATE entry in the Used Dimensions window. Click on it and then click the Remove button

  • Now, click on Add Calculated Dimension... the Edit Expression window opens up. We're going to add an expression that yields a weekly date to replace SHIPDATE. Type in this expression:
    WeekStart(SHIPDATE)

  • Click OK to close the Edit Expression window

  • Give our new dimension a name- type WEEK in the field name box. See how it might look in the diagram below.

  • Click OK to close the Chart Properties window


Now the chart shows data by WEEK instead of SHIPDATE. This same method can be used for other types of date conversion functions or most other kinds of numeric or text string calculations. It lets you use a chart dimension even though the dimension data doesn't actually exist that way in the loaded data.

Wednesday, August 20, 2008

More you can do with Partial Reload

See the previous posting about removing tables. In the same way that you can enter a Drop Table command to remove a QlikView table from an existing report, you can enter these commands which will affect the existing report already loaded with data:
  • To remove a field from every QlikView table in which it appears, enter Drop Column;
    For example, for privacy reasons you might want to get rid of social security number data in your report before sharing it with your team. You might enter:
    Drop Field Customer_SSN;

  • To remove a field from specific table(s), for example, you might enter:
    Drop Fields Customer_Name, Customer_SSN from CUST_MSTR_TABLE, ORDER_HDR_TBL;

  • To change the name of a column or field in every table in which it appears enter Rename Field; (remember that the field names are how QlikView relates or "joins" the tables together so this one affects that table relationship).
    For example, you might enter:
    Rename Field domestic_custno to North_America_Customer;

  • You can change the name of an existing table. For example, you might enter:
    Rename table domestic_sales to North_America_Sales;

All of these commands can also be used in the loadscript during a normal load but they can be especially useful for fixing issues when used with an existing report that is already loaded with data. Remember to put them at the top of the loadscript, add an Exit Script; command and then execute the commands with the Partial Reload. The rename commands can be used with a mapping table if you think you might need more powerful renaming capabilities. Refer to the Help Text or Reference Manual for info about how to use a mapping table for renaming fields and tables.

How to remove an existing table


For this first blog entry we'll talk about something simple although maybe not a beginner's task. How do you remove a QlikView table from an existing report that is already loaded with data? There's a variety of reasons you might do something like that: to remove a large table and reduce the size of the report, maybe the data in one table is incorrect or causes incorrect results in the charts, or maybe you intend to share the report with Marcy in Finance and she just doesn't need to see the sales forecast. Whatever the reason, it is fairly easy to remove a table.

First, make a copy of the report you are going to change so that you can restore the report in case something goes wrong or you make a mistake (it happens). Open the report, then select File->Edit Script from the menu. It will open the loadscript edit window. Insert a few blank lines at the very top. Now type in a drop table command for the table you want to remove. For example, if you want to remove the NEW_ORDERS table then type in
DROP TABLE NEW_ORDERS;
EXIT SCRIPT;


Don't forget the semi-colons at the end of those lines. It might look something like the picture up above.

After you type the new lines in the loadscript, review the lines to make sure everything is spelled correctly and click on the OK button to close the edit loadscript window and then select File->Partial Reload from the menu. The partial reload choice will execute your new loadscript lines down to the Exit script line and then stop. The NEW_ORDERS table has now been removed from the report. If you ever expect to reload the report again you should edit the loadscript again and remove the new lines you just inserted. Then click OK to close the edit loadscript window and Save the report (or do a Save As to save the report under a different file name).