Wednesday, November 26, 2008

Listing All Variables and Contents

[Author's note:  You can see information about a different method for accomplishing this same thing. Search on: QlikView Maven Utility That Can Extract and Show All of the Variables ]

After last weeks blog posting I got some questions about how you might list out all of the document variables and their contents. It can be a useful thing for reports that depend on variables for their functionality and useful for corporate developers who must document report functionality.

Below is a Microsoft Excel macro that could help you. When you run this macro it will ask you to select a QlikView report file and then it will copy all of the document variables and their contents into the current worksheet. Once the data is in a spreadsheet you can sort it, print it, search it for particular fields or functions, or write it out as a text or tab-delimited file. In a future blog posting I'll show how variables can be loaded into a report from a spreadsheet which, along with the macro below, will give you a method for sharing and maintaining variables.

You can get a copy of the spreadsheet with the macro installed and a button that runs the macro at this website:  [Author's note - old site is not working anymore].  The spreadsheet on the website also includes a button that will list all variables from a currently open QlikView document (sorry about the advertisements on the site - just click on the spreadsheet downloads).
Here's the Excel macro code. You can copy and paste the macro code from this window and put it into your own spreadsheet if you want to build your own.

Sub List_QV_Variables()
'This Excel macro will ask you to select a QlikView Report File and
'then it will put the variable names and contents into your current worksheet
'--Tim Benoit, Nov 2008
Dim oQV, oRpt, oVars, oTempVar, oThisVar, qv_fn

'Get the QlikView report pathname
qv_fn = Application.GetOpenFilename("QlikView Report File (.),*.*", , "Select a QlikView .qvw Report File", False)
If qv_fn = 0 Then
  Exit Sub
  End If

'Write out some heading text
ActiveSheet.Cells(1, 1).Formula = "QlikView Variables List"
ActiveSheet.Cells(2, 1).Formula = "Report pathname:"
ActiveSheet.Cells(2, 2).Formula = qv_fn
ActiveSheet.Cells(3, 1).Formula = "Variable Name"
ActiveSheet.Cells(3, 2).Formula = "Variable Content"

'Open the QlikView report file
Set oQV = CreateObject("QlikTech.QlikView")
Set oRpt = oQV.OpenDoc(qv_fn)
Set oVars = oRpt.GetVariableDescriptions
'Loop through the variables
For i = 0 To oVars.Count - 1
  Set oTempVar = oVars.Item(i)
  varname = Trim(oTempVar.Name)
  Set oThisVar = oRpt.Variables(varname)
  varcontent = oThisVar.GetRawContent
  'Write data into worksheet cells
  ActiveSheet.Cells(i + 4, 1).NumberFormat = "@"
  ActiveSheet.Cells(i + 4, 1).Formula = varname
  ActiveSheet.Cells(i + 4, 2).NumberFormat = "@"
  ActiveSheet.Cells(i + 4, 2).Formula = varcontent
  Next

'Close QlikView
oRpt.CloseDoc
oQV.Quit
End Sub

Friday, November 21, 2008

Copying Variables From One QlikView Document to Another


Today, one of the guys at work was trying to figure out how to transfer all of the document variables from one QlikView document to another. We discussed some of the things we've done in the past: loading variables and values from a spreadsheet or database either through the loadscript or through macro code. We even have an older application that stores variables in a table with loadscript code and then the document is used as a "binary" in another document's loadscript and the second document turns the table values back into variables. But, none of those options seemed to fit the requirement. One obstacle is that we could not figure out an easy way to export all of the variables and values from a document. You can export the expressions from the Expression Overview but the Variable Overview has no similar function.

With some help from Lars at Brait AB (a reader of this blog, Thanks, Lars!) who suggested a way to loop through the variables, I tested the VBScript below that can transfer variables from one document to another. I created a small text file on my laptop named "tbtest.vbs" and typed this code into it:
' /* Test Moving a variable from one QV document to another */
' /* QlikView Maven, Nov 2008 */
Option Explicit
Dim objQV, objSource, objDest, objSourceVar, objDestVar
Dim objVars, varcontent, objTempVar, varname, i

'initialize
Set objQV=CreateObject("QlikTech.QlikView")
Set objSource=objQV.OpenDoc("C:\QVfolder\Source_rpt.qvw")
Set objDest=objQV.OpenDoc("C:\QVfolder\Dest_rpt.qvw")
set objVars = objSource.GetVariableDescriptions

'Loop through the variables
for i = 0 to objVars.Count - 1
  set objTempVar = objVars.Item(i)
  varname=Trim(objTempVar.Name)
  Set objSourceVar=objSource.Variables(varname)
  varcontent=objSourceVar.GetRawContent
  'display the variable to check on progress if needed
  'msgbox(varname & " = " & varcontent)


  'update the value of variable in Destination document
  Set objDestVar=objDest.Variables(varname)

  If objDestVar is nothing then
    'must need to create variable
    objDest.CreateVariable varname
    Set objDestVar=objDest.Variables(varname)
    End If

  objDestVar.SetContent varcontent,true


next 'end of loop

'save Destination document if desired
objDest.Save

'we're done, close down
objSource.CloseDoc
objDest.CloseDoc
objQV.quit
WScript.Quit


In order to run it, I just double-clicked on the tbtest.vbs file on my desktop. You can see the pathname to the two QlikView document files in the code. This script successfully copied the variables and their values from the source to the destination document.
If you omit the part of the script that opens and updates the destination document you could turn it into a script that lists out all of the report variables and their contents -- something that is not available with the regular variable overview.

Friday, November 14, 2008

Putting a Count in the Chart Title

In my company we write a lot of QlikView reports to validate data. As part of our software projects we must check data to see that it matches assumptions and expectations. We also check the data against any other source available to validate data accuracy. Often, one of the simpler but important things on those reports is a count of things.

For example, a report might include a table box showing ITEM data. Instead of just showing the word ITEM in the table box title, we put a count of the ITEMs in the title. You can change the title on most sheet objects by right-clicking on the object and choosing Properties. The Title is in the General tab. The title might contain this:
=Num(Count(Distinct ITEM),'###,###') & ' ITEMs'

That gives us a count of the number of ITEMs that is formatted with the NUM function to use a comma as a thousands separator. The title then might show up on the chart as:
  1,220 Items

A List Box for the field named Location might contain this in the title:
=Num(Count(Distinct Location),'###,###') & ' Locations'

For another title you might want the number of sales orders in fiscal 2009. You can add an If test with a text expression like this:
=Num(Count(Distinct If(fiscal_yr='2008',order_id)),'###,###') & ' 2009 Orders'

These counts will change depending upon your current selection. The counts don't necessarily need to be in a title. The object title limits you to a single line of text. You can put the counts into a text box and that will allow you to show the information on multiple lines. If you type this into a text box:

=Num(Count(Distinct ITEM),'###,###') & ' ITEMs
' & Num(Count(Distinct Location),'###,###') & ' Locations
' & Num(Count(Distinct SDATE),'###,###') & ' Shipping Dates'


Note that the end-of-line or carriage return is part of the text. The text box will show up on the report saying something like this:
  1,220 Items
  15 Locations
  52 Shipping Dates


We have a report with a table box of SKU data where SKU ("stock-keeping unit") is a combination of item and location although the item and location fields are separate. The title for that table box contains this text expression that counts the number of occurrences of the concatenated item and location field values:
=Num(Count(Distinct ITEM&'@'&LOC),'###,###') & ' SKUs'

We often use charts with a cycle group in the dimension. That allows the report user to easily switch the chart dimensions. The current setting of the cycle group can be used in the report title if it makes sense. So, for a chart where the cycle group is named "Corp Group", you can make it a part of the chart title like this:
='Sales History by ' & GetCurrentField([Corp Group])

and then the chart title will switch between
  Sales History by Customer
  Sales History by Fiscal Month
  Sales History by Region

as the report user clicks to switch dimensions using the cycle group.

For a slightly more complex example of using the cycle group, consider a chart where the dimension is a cycle group named "Corp Group" and we want to include a count of dimension rows in the title. You could make the chart title like this:
='Sales History - ' & Num(Count(Distinct $(cg_label_1)),'###,###,###') & ' ' & GetCurrentField([Corp Group]) & 's'

You must also define a document variable named cg_label_1 that contains the name of the specific cycle group being used in the dimension. The variable would contain this text:
=GetCurrentField([Corp_Group])

now the chart title will automatically switch between text like this as the cycle group changes:
  Sales History - 4,800 Customers
  Sales History - 12 Fiscal Months
  Sales History - 6 Regions

Sunday, November 9, 2008

Set Analysis

In QlikView version 8.50 there is new functionality called Set Analysis. A "Set" as used in this functionality is similar to the already familiar concept of a QlikView Selection. This functionality allows you to define chart expressions that are calculated using something other than the current selection.

QlikView's Selection capability is already a powerful, flexible capability -- essentially a grouping of data defined any way you choose. With Set Analysis you can compare two or more of these groupings quickly and easily. In the past, this kind of functionality in a QlikView report usually required special handling in the loadscript and table structure. Now, the Set Analysis can be set up using chart expressions and existing data.

I'm sure that I will be writing again about the capabilities of this feature, so today I will only offer two examples of what can be done. These are simple to try out on a report so be sure to try them. Remember though that you will need new version 8.50. You can download the latest version of QlikView from the QlikTech or QlikCommunity websites.

Examples:

Imagine that you have a chart and one of the expressions shows historic inventory quantity. It might look like this:
Sum( qty_inv_hist )

Now, add a new expression next to that first one that will show historic inventory quantity but using the Previous Selection. "Previous Selection" is the selection you would get if you clicked on QlikView's Back button. The expression might look like this:
Sum( {$1} qty_inv_hist )

Note the curly braces that are part of this syntax. You now have a chart that compares data from the current selection to data from the previous selection. This is a very flexible feature. The previous selection might be: data from your top 5 sales regions, data from last month, data from last year, data from the Western states, data from regions where the new product has been introduced, data from products using blue labels, data from customers added in 2005, data from orders shipped by rail, etc. Get it? With little effort you can do kinds of data analysis you might never even have thought of before.

Now, add another expression that will be calculated using a selection stored inside a bookmark. This is what the expression might look like for a bookmark named "TB Item List":
Sum( { "TB Item List" } qty_inv_hist )

Quotes are required around the bookmark name because it contains spaces (you could also use square braces, [ ], instead of quotes). The idea is similar to the expression that used a previous selection except that now the selection used in this expression will be based on the bookmark selection no matter what the current selection is in the report. The bookmark can be changed at any time, of course, and some people might find this feature easier to control than the one based on a previous selection. Using a bookmark is appropriate too for a complex selection that involves making selections from several fields. The idea of a Previous Selection as in the example above works only for the most recent field where you made a selection. If the selection you want to use in the chart expression involves several fields then a bookmark is the way to go. To make this a little easier for report users, you could use a variable in the expression for the bookmark name and give the report users an input box so that they can choose the bookmark to use without opening up the chart expressions. Remember that bookmarks can be exported and shared even among dissimilar reports (Click here to read a little about sharing bookmarks).

The reference manual recommends that these set analysis features not be used on expressions that do calculations using fields from multiple QlikView tables. For example, an expression that multiplies historic inventory by a cost factor should not be used if the cost factor is from a different table within QlikView than the table where historic inventory is stored. Note that is is about where the fields are stored within the QlikView tables - it has nothing to do with the external source tables that were used for loading data. The manual says the results are "unpredictable" -- that's a good enough warning for me... it's like when the waiter says "don't order the fish" - you really will be better off if you take his advice and don't have fish for lunch.

If you are interested in the Set Analysis functionality it will be worth your time to read about it in the version 8.50 reference manual. Post a comment to this blog or send me an email if you think of something unusual or clever you can do with set analysis.

Variable Overview

I wrote about the Expression Overview in a blog posting last week (Click here to read it) so I feel I must drop the other shoe and mention the Variable Overview that is available in the same menu, Settings->Variable Overview or hold down the Ctrl+Alt+V keys at the same time for a hot-key shortcut.

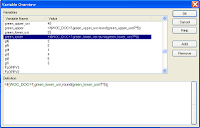
The Variable Overview window shows two columns: Variable Name and Value. Click on the column headings to sort the list. Click the Add button to add a new variable. If you click on one of the variables to select it, you can remove it with the Remove button or edit the variable value in the Definition box in the bottom of the window. For a long, complex variable you can click the tall button labeled with an elipsis (". . .") to open a full-screen window for editing.

There's no way to print the contents of the window or export it to a file or search through the contents but the Variable Overview is very useful for working with reports that use a lot of variables. There is a Help button but on my copy of QlikView it doesn't sense the context and it opens to the wrong Help window.

There is a method that can be used to list out all of the document variables and their contents (Click here to read about it)

Saturday, November 1, 2008

Expression Overview


If you work with moderately complex reports then you must be working with reports with expressions. Most of the time we're concerned with expressions in chart objects (the graphs or tables with dimensions) but there can be expresssions in many places in a QlikView document. An expression might control whether a tab or chart is visible or not or it might control colors used in a chart. An expression might be used in a text object to provide customized information or a warning, or it might be used in a chart title to provide a customized title. In version 6 the only way to maintain these expressions was to remember where they are and open up each object to check on specific expressions.

In recent releases of QlikView there's a great feature called the Expression Overview. To see it, select Properties->Expression Overview (or, hold down the ctrl key, the alt key and the E key at the same time). This overview shows you where the expressions are in your document, it can show you the text of the expression, it will allow you make changes to the expression, you can search for specific text in the expressions like a field name or variable name, and you can do mass changes with the search and replace functionality.

There's no HELP button but you can make the Expression Overview Help screen appear if you press your F1 button. The Help screen will explain the available functions.

As always, if you are going to make serious changes to a document it's a good idea to make a backup copy of the document first, just in case you make a mistake and want to restore the document back the way it was.

My own preference, when I want to search for a particular kind of expression or if I just want to review all of the expressions in a report looking for problems and opportunities is to use the Export button to export all of the Expression Overview data. A box will appear asking for the pathname to use for the exported text file. The text file is a tab-delimited text file that can be reviewed with Notepad or Wordpad or a spreadsheet (or loaded into QlikView!).

The exported Expression Overview text file makes an excellent addition to documentation for a complex report for those of you who are required to produce documentation.

Note that expressions from hidden charts and other hidden objects are not included in the Expression Overview. This can be a good way to intentionally limit some of the expressions shown if you can hide specific objects. For myself, before I use the Expression Overview, I usually go to Document Properties, Security tab, and temporarily click on Show All Sheets and Objects. That way I get an overview list of every expression in the document.