Sunday, February 22, 2009

Report Tells User ABOUT The Data

Last week a coworker, who was working on a report to validate some data sent to us by a client, asked me how to highlight null values in a chart in the report. I showed her how to do that (Click here to read it). And I offered another suggestion: you don’t want your report user to have to scroll through a lot of data or have to sort the chart to find out if any null values exist; it will help the report user if you provide a text box that tells right away if any nulls or zeros or whatever other interesting conditions exist in the data. Then, the report user can decide how to use the other objects on the report to analyze the data.

This report was a data validation report but the idea can be used for executive summaries and other kinds of reports. The goal is to have a text object that uses easy-to-understand language to tell the report user about important aspects of the data. The idea is similar to the discussion of putting counts in a chart title from a few months ago (Click here to read it). When you design a text object like this you should ask yourself: “what things will the report user be looking for in this report?” and “what questions will the report user be asking of the data?” The text box is telling the report user important things About the data not just summarizing the data.

Here’s what we tried out in the text box of a draft version of that report:

='Current Selection Data Issues:
'&
If(sum(If(Len(Trim(product))=0,1,0))>0,'Data contains null product values.
')&
If(sum(If(Len(Trim(ship_loc))=0,1,0))>0,'Data contains null ship_loc values.
')&
If(sum(If(Len(Trim(mkt_channel))=0,1,0))>0,'Data contains null mkt_channel values.
')&
If(sum(If(Len(Trim(ship_loc))>0 and Len(Trim(ship_loc))<>4,1,0))>0,'Data contains wrong length (not 4) ship_loc values.
')&
If(sum(If(qty<0,1,0))>0,'Data contains negative qty.
')&
If(sum(If(qty=0,1,0))>0,'Data contains zero qty.
')&
If(sum(If(qty<>floor(qty),1,0))>0,'Data contains fractional qty.
')&
If(sum(If(Len(Trim(qty))=0,1,0))>0,'Data contains null or blank qty.
')&
If(sum(If(qty>100000,1,0))>0,'Data contains unusually large qty.')

That text expression only shows the messages if the data conditions actually exist. If some important data condition can only be detected during during data loading then consider capturing the important condition in a document variable while the loadscript is running and then use the document variable in the text box.

We also added this little text box of various counts:

='Current Selection Contains:
'&Num(Count(Distinct product),'###,###')&' products
'&Num(Count(Distinct ship_loc),'###,###')&' ship_loc
'&Num(Count(Distinct mkt_channel),'###,###')&' mkt_channels
'&Num(Count(Distinct product&'.'&ship_loc&'.'&mkt_channel),'###,###')&' SKUs (product/ship_loc/mkt_channel)
'&Num(Count(Distinct orderid),'###,###')&' orders
'&Num(Count(Distinct shipdate),'###,###')&' shipdates, '&min(shipdate)&' to '&max(shipdate)

The data issues text box could also have been written to show counts of the various issues.

Another interesting way to use text expressions like that is in a straight table chart. You can set up the chart with a dimension like shipping-location and put the text expression (minus that first line which is a title) in the chart expressions and then you have a chart that uses easy-to-understand language to tell about data conditions for each shipping-location.
Saturday, February 21, 2009

Highlighting a Chart Value


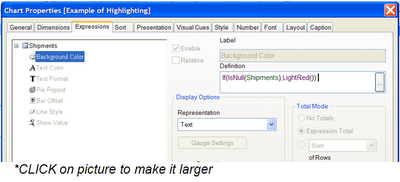
I was asked, “How do you highlight a null value in a straight-table chart?” If you want to set the background color or text color based on a range of expression values then the Chart Properties->Visual Cues is the way to go. But the Visual Cues tab doesn’t work well for null values and it won’t help if you want to highlight the value based on anything more than a simple test of values. For that, you want to use a separate, special expression to set the background color or text color.

Right-click on the chart and select Properties and go to the Expressions tab. Click on the little plus sign ( + ) to the left of the expression you want to highlight. See the example in the picture above. In the example, the expression is named Shipments and I have clicked on the Background Color choice and entered this expression into the box:
  If(IsNull(Shipments),LightRed())

That expression tells the chart to use the LightRed color as a background color when the Shipments value is null. There are other colors you could use – search on color functions in the Help text to find information about other colors. Background color works well to highlight values in a straight table chart but it won't help with line graphs or bar charts. The expression can include other factors like the source of the data or the value in the chart dimension or the average monthly sales volume for 2008; use whatever factors that provide a reason for pointing out that particular expression value.

Thursday, February 12, 2009

Capture Variable Values in the Loadscript


I often put statements in the loadscript that record current conditions as document variables in case the information might be useful someday when checking into a problem or simply to document the origin of the data. Here’s a few that have proved useful:

let reload_time = now();
let user = OSuser();
let computer = ComputerName();
If IsPartialReload() then
   let partial_reload_time = now();
Else
   let partial_reload_time = '';
End If

Those variables can be displayed on the title tab or in a corner of the main tab.

You can capture information from the data that is being loaded and store it in a variable. This is useful for control information that would be displayed on the title page like the system information above. It can also be useful to control If statements and Loops and Where clauses in the loadscript.

Here’s an example that reads a date from an Oracle table and stores it in a QlikView document variable so it can be displayed in a chart title:

//Find OHPOST date and store in a one-row table
DUNK_OHPOST:
SELECT TO_CHAR(MAX(OHPOST),'MM/DD/YYYY') AS DUNK_OHPOST FROM SKU;

//Now, put the value into a document variable
Let DUNK_OHPOST=Date(Peek('DUNK_OHPOST',0,'DUNK_OHPOST'));
Drop table DUNK_OHPOST;

That Peek function takes 3 arguments: fieldname, row number, and table name. For a one-row table use zero to indicate the first row. If that is a unique field name then you could also use the FieldValue function to retrieve the value from the first field value.

In older QlikView versions you could use the Peek function in a text object but that isn't allowed any longer. So, store the values in document variables and you can display them in text object or chart titles. Consider displaying data values that tell the report user something important about the data; such as earliest or latest posting dates, high or low order numbers, current fiscal period, currency conversion factor, source application version number, security or classification warning, etc.