Showing posts with label field names. Show all posts

Saturday, May 27, 2017

Data Profile Tool

I’ve written in this blog before about how I’m often called on to validate a new data file from a client or to examine a new data extract. My first step is to load data into a copy of Steve Dark’s Data Profiler (Steve's original post is useful - search on quickintelligence data profiler). The data profiler gives me information about exactly what values exist in each of the fields.

I’ve made a few modifications to Steve’s original document:
  • Added a table box that adjusts itself to the fieldnames in the file
  • Added a small macro that updates the Statistics Box with the fieldname automatically as different fieldnames are selected. A trigger detects the change and automatically configures the Statistics Box
  • Added a tab to help search for duplicate values in either a field or combination of fields
  • A check in the loadscript to see if the file exists and if it does not exist then it opens a msgbox from the loadscript using a function


You can download an example copy of the file data profiler that I use by clicking HERE
.

I also keep a version of the data profiler that is tailored for loading data from an Oracle table and a version of the profiler tailored for loading data from a qvd file. I think I use the data profiler tools almost every day to examine data in files and tables to help with QlikView document design and other reporting requirements.

These two examples have no data loaded - you will have to do a reload yourself from your own data:
  • You can download an example copy of the profiler I use for qvd files by clicking HERE
  • You can download an example copy of the profiler I use for Oracle tables by clicking HERE


  ★★★

Sunday, May 14, 2017

Have you got a function similar to SQL NVL ?


I work with a group of people who are all experts in SQL. They all also have varying levels of technical skills and QlikView skills. One question I get frequently is whether QlikView has a function like the SQL NVL function.

For those of you not familiar with relational database SQL language, the NVL function takes two arguments: a field name or expression and a default value to be returned if the first argument is null. For example, a SQL database query may include the function like this:
  NVL(ORD_DISCOUNT, 0) AS ORD_DISCOUNT
And that would tell the SQL processor to look at the value of ORD_DISCOUNT and if it is null then return 0 as the function value otherwise return ORD_DISCOUNT.

When people ask about achieving the same thing with QlikView, I usually start by telling them that they can code an “if” statement like this:
  If(IsNull(ORD_DISCOUNT), 0, ORD_DISCOUNT)
and then I explain that there is a built-in QlikView function that can be used similar to NVL as long as the field you are checking is supposed to be numeric. It is the Alt function.
The Alt function accepts any number of arguments and looks at each of them going from left to right and returns whichever one is a valid number. So, repeating our example, if ORD_DISCOUNT is null then the following function will return a zero but if ORD_DISCOUNT is a valid number then the function returns ORD_DISCOUNT:
  Alt(ORD_DISCOUNT, 0)   

The Alt function will treat the last or rightmost argument as an “else” condition and return that value if none of the preceding arguments are numeric. The rightmost value need not be numeric so you could code something like this:
  Alt(ORD_DISCOUNT, 'Discount is missing')

The Alt function may be used in the loadscript code or in chart expressions.
If you are interested, the QlikView Help (search in Help for Conditional Functions) shows an interesting example for how the Alt function can be used to identify a date when the date value may be any one of several different date formats.  


  ★★★

Thursday, December 24, 2015

Chart Adjusts to Whatever Fieldnames are Loaded


I’m often called on to validate a new data file from a client or to examine a new data extract. My first step is to load data into a copy of Steve Dark’s Data Profiler (search on quickintelligence data profiler). I’ve made a few modifications to Steve’s original document – here are a couple of the most useful.

I added a line to the loadscript that uses preceding load to add a record number to the rows being loaded. My line is added between the table label and the first line of the regular Load statement. It looks like this:

DATAFILE:  //table label
Load *, recno() as zrecno;  //this is the preceding load line
Load   //this is the beginning of your "regular" Load statement

For the second set of modifications, I added a new sheet or tab which I named Table.
On the new tab, I added a multibox and then I added, not fieldnames, but 20 expressions. You can add any number you like but 20 seemed like plenty. These are mostly copy and paste so they are not a lot of typing and you can start by copying the expression shown in this blog and pasting it into your document. The first multibox expression looks like this:

[$(=only({1<$FieldNo={1}>} $Field))]

That expression evaluates to the fieldname corresponding to field #1. Then I add a second expression to the multibox:

[$(=only({1<$FieldNo={2}>} $Field))]

You can see that in the second expression, I changed $FieldNo={1} to $FieldNo={2} so that the second expression evaluates to the fieldname corresponding to field #2. I did that for each of the 20 expressions so that the 20th expression in the multibox contains $FieldNo={20}

Then, I added a straight table chart. I used zrecno as the dimension. Then, I added 20 expressions. For the first expression, I typed this:

[$(=only({1<$FieldNo={1}>} $Field))]

And for the label, I typed this:

$(=only({1<$FieldNo={1}>} [$Field]))

Again, the rest of the expressions are similar, each time changing the $FieldNo={1} to be 2 for the second expression and its label, $FieldNo={3} for the third expression and its label and so on for each of the 20 expressions. Click OK when you’re done.

Now, you have a multibox and a straight table chart that appear as though you typed in the 20 fieldnames. But, these objects will adjust themselves to whatever fieldnames are loaded. If you load a file with less than 20 fieldnames, the “extra” ones will just be null.

You can copy and paste these objects into other QlikView documents and they will adjust themselves to whatever the first 20 fieldnames are in the document (see important info in first blog comment below). But, I think these are most useful in a document where different fieldnames can be loaded each time.

I checked Dropdown Select for all columns in the Presentation tab to make it easier for the document user to make selections on the chart. 

In order that we don’t burn up all of the memory on the computer, I added a calculation condition to the straight table chart with this expression =if(count(zrecno) < 200000,1,0) so that the chart will refuse to appear if there are more than 200,000 rows. I customized the error message for the calculation condition to say, “There’s more than 200k rows. You have to make some selections to reduce the amount of data in this chart.” A calculation condition like this is a good idea whenever you have an object that might try to show more data than is possible with the available memory.

  ★★★ 

Saturday, January 31, 2015

General File Loading Technique

Here’s a technique I first used several years ago when I started a project where we had several dozen data files, all of them containing different data, in a delimited format and each of them with a header record as the first record containing the field names. The loadscript code below shows how we could load each of the files into different QlikView tables using the same loadscript.

The code below has the filename in the code but it could be loaded into the QlikView document by including the filename as a variable in the command line execution of QlikView (for an example, search on "qlikview maven command line and automation").  Other options include building a loop and loading each of files in a folder (search on “qlikview maven loading all of the files from a folder”); or, if you are comfortable with macro module code, you could use a browse-for-file technique to make it easy to find and load a filename (search on “qlikview maven browse-for-file macro button”).

Here’s the loadscript example code:  (some of the long lines are wrapped around as you view the code in the blog window but they will go back to normal if you copy and paste the code into a text file or loadscript edit window) 

Set xfile='customer_data_12.csv'; //file pathname
Let xfile=Upper('$(xfile)'); //optional convert to upper case

FIELDDAY:  //load first record only 
Load * from $(xfile)
(txt, no labels, delimiter is '|') 
where recno()=1;  //note "no labels" 

Set loadstatement='Load '; //now, build the Load statement
For i=1 to 100
Let fn=trim(SubField(peek('@$(i)',0,'FIELDDAY'),';',1));
if '$(fn)'='' then 
  exit for
  end if;
if $(i)=1 then
  Let loadstatement='$(loadstatement) @$(i) as [$(fn)]';  
else
  Let loadstatement='$(loadstatement), @$(i) as [$(fn)]';
  end if
Next

$(xfile): //QlikView table name
$(loadstatement) 
FROM
$(xfile) 
(txt, no labels, header is 1 line, delimiter is '|'); //change delimiter character as needed

Drop table FIELDDAY;

Store $(xfile) into $(xfile).qvd (qvd); //optional save as qvd
//Drop table $(xfile);  //optional drop table

Change the file attributes as needed for your situation: for example, Excel files, skip over unneeded header records, different delimiter, etc.

There are two important ideas illustrated in the example:  first, the idea of loading the header record of a file and building a custom load statement on the spot; second, the idea that you can construct any loadscript statement or part of a statement in a variable and execute it just by putting the variable in the right place in the loadscript.

This technique helped me in a recent project where the data files were supplied with field names in the header record but all of the field names needed a little modification in order to use them. Some of them I converted to upper case and some of them needed to have special characters removed. It was easy to add the necessary text functions to edit the field names as the code assembled the load statement.

It will help you debug and validate this technique if you set the document properties option to write out a loadscript log file when the loadscript runs. The log file will show all of the lines in the loadscript as they were executed with variables fully expanded.

  ★★★

Thursday, April 24, 2014

Note About Dollar-sign Expansion

Katrina, from the Marketing Group, came to me yesterday with a QlikView document she was working on. It had three scatter plot charts arranged side-by-side and she wanted to make the side-by-side comparison easier by making them all have a similar Y-axis. She knew she wanted something for the static max property of the charts so that each would have the same maximum value for the Y-axis. She knew the basic expression to calculate the maximum value but the charts have a cyclic or cycle-group in the dimension and she needed an expression that would work with the cycle group.

I knew that she needed a dollar sign expansion (to handle the cycle group) and an aggr function (to find the maximum value by dimension) so I scribbled an expression like this on a sheet of note paper and Katrina left to try it out:
Max( aggr( your-calculation-of-y-value, $(=getcurrentfield( your-cycle-group-name )))

An hour later, I got an email from Katrina saying that the expression wasn't working. I decided to take a closer look at her document. The cycle group dimension in the charts is named “Scatter ExErr”. It contains a space or blank in the middle of it—so when it is used in an expression it must be surrounded by square brackets like this [Scatter ExErr]    (Note that double-quotes should work as well as square brackets.)

But, the expression still wasn't working correctly and it returned a null value. When I examined the field names used in the cycle group I saw that some of those also contained a space inside the field name. When you use a dollar sign expansion with a getcurrentfield function in your expression you can think of it as though the dollar-sign expansion becomes the field name before QlikView calculates the expression. Since the field name contains an embedded space then it must also be surrounded by square brackets and in this expression that means surrounding the dollar-sign expansion in square brackets. Katrina’s expression now has two pairs of square brackets and looks something like this:
Max( aggr( your-calculation-of-y-value, [$(=getcurrentfield([Scatter ExErr] )] ))

In documents that I develop, I avoid putting embedded spaces into any names that are not actually visible in the charts and I use an underscore character if it is needed to make a field or object name easier to read. If you decide to name things with names containing embedded spaces remember that you usually have to surround the name with square brackets or double quotes when the name is used in a function or expression.


★★

Saturday, March 2, 2013

Referring to a Column Label When the Label is a Text Expression


Last week, I added an enhancement to a QlikView document that had been in use for over two years. My task was simply to add a column to a straight table that would have an expression like this:  =[column1] - [column2]. It should be pretty simple. 
But the two columns I needed to refer to had text expressions using variables in their column labels. The two column labels looked like this:
=abv_PRICE&' '&lbl_Cmpr&' '&abv_EUAVG
=abv_COST&' '&lbl_Cmpr&' '&abv_EUSTD 

It took a few tries to get the syntax right. I didn't change the existing columns but I copy and pasted their label expressions into my column expression and then modified the syntax and added dollar sign expansion. The expression for my new column still refers to the two other columns using their column labels within square brackets; it looks like this: 
[$(='$(abv_PRICE) $(lbl_Cmpr) $(abv_EUAVG)')]-[$(='$(abv_COST) $(lbl_Cmpr) $(abv_EUSTD)')]

I hope this might help someone with a similar problem to solve. 

★ ★ ★

Wednesday, May 2, 2012

List Box to Select Values From Two Fields at Once


I posted this answer on QlikCommunity yesterday and several people remarked on it so I thought I’d repeat it here.

I recently had a QlikView document that showed lagged sales forecast data. There were two date fields used in the data: a Create_Date indicating when the sales forecast was created, and, a Fcst_Date indicating which week was being forecasted. For example, a forecast of sales for the week of June 21st might be created two weeks earlier on June 7th. Then the Create_Date would be 07JUN2012 and the Fcst_Date would be 21JUN2012.

In the document, in addition to other list boxes and a multibox, I added a list box that allows a user to view and select values from both date fields at the same time.
I created a new List Box and in the Properties General tab, I didn’t select a field, instead I chose <expression> and typed this into the expression:
='Create date=' & Create_Date & ' and ' & 'forecasted week=' & Fcst_Date
I made the title of the list box “Select Create and Forecasted Dates”.
Now, I had a list box that showed the pairs of dates that occur in the data. The values in the list box can be green when they are selected or white when they are possible values and gray when they are excluded values just like any other list box. When I click on a value in the list box it selects the corresponding values from each of the two date fields at the same time.

One additional refinement was to make the values sort the way I want them. I opened the Properties of the list box and chose the Sort tab and checked the Expression box and then in the expression box I typed just the field name, Create_Date

This idea would work with any pair (or trio) of fields where being able to view the field values together and select the values together makes sense.


  *  *  *

Wednesday, April 4, 2012

Translate a Field Name into a User-Friendly Field Label


In my last two blog postings and in the one I’m preparing for next week I’ve described techniques that use the GetCurrentField  function. Sometimes, a problem with that function is that it returns a field name which may not be recognizable to the people using a QlikView document. Here’s a technique that can translate the field name into a more user-friendly field label.

First, define a table in the loadscript that lists out the field names you will be using in your cycle groups and the corresponding field labels. Here’s a small example using some SAP field names:

FLD_LABEL_MAP:
Load * Inline [fldname, fldlabel, fldshort
MATNR, Material, Matl
WERKS, Warehouse, Whse
KUNNR, Customer, Cust];


Now, imagine that you have a chart showing sales totals with a cycle group named SLSCYCLE in the chart dimension that allows the user to click through three values in the cycle group: MATNR, WERKS, or KUNNR. You would like to refer to the current cycle group choice in your chart title but your document users don’t normally use actual field names when they discuss the data. You can use your preferred field label in the chart title with a text expression like this:

='Sales Totals by ' & Only({<fldname={$(=GetCurrentField(SLSCYCLE))}>} fldlabel )

In that expression, the Only function is included as a way to use Set Analysis syntax to retrieve the user-friendly  fldlabel value corresponding to the field name.
The expression could have used the alternate short label fldshort in a place where shorter text is required. The little FLD_LABEL_MAP table could also contain other data elements related to the field such as the name in a different language or a short piece of help text.

 *  *  *

Sunday, March 18, 2012

Using Cycle Group in a List Box Expression


Here are a few more ideas from the Directed Creativity exercise in finding other ways to use Cycle Groups.


You can use expressions in a list box such that only field values satisfying a condition are shown. I’ve written about that before and it has been quite useful (See QlikView Maven from 1Sept2010). Today, we’re looking at expressions that contain a cycle group. This will allow a list box to initially show a list of products with high sales, for example. Then, after clicking on the cycle group icon, the same list box will be showing a list of customers with high sales. The report user need only select values from the list box or right-click and select-all to select the things satisfying the special conditions.


As in last week’s blog posting, I created a cycle group named xgroup containing field names related to sales: product name, sales person, price group, customer, and shipping facility. A typical expression I might use in a list box is to show the top 15 products by sales quantity. Using the cycle group I can define the list box with an expression that easily clicks through the top 15 products, or top 15 sales persons, or top 15 price groups, or top 15 customers, or top 15 shipping facilities.


The values shown in the list box are affected by selection, so, for example, if I start by selecting beverage sales only, then my list box values for the top 15 things is limited to the top 15 things within beverage sales.


Here’s what that kind of expression looks like:


=aggr( if(rank(sum(SALES_QUANTITY),4)<=15, $(=GetCurrentField(xgroup)) ), xgroup)


The title for the list box needs to use the current cycle group choice to make it clear what kind of things are shown in the list box. For my example, the title is a text expression that looks like this:


='Top 15 '&GetCurrentField(xgroup)&'s Based on Sales Quantity'


I can make a series of list boxes like that, each with an expression that shows me something important about the sales information in my document. Or, better yet, use the various expressions as choices in a Multi Box which takes up less room on the screen (although, the list boxes have the advantage of showing the values all the time—as you click through the cycle group you can see the list box values all change as the various cycle group fields are chosen). With simple changes to each of the expressions, my multi box might cover:


  • Top 15 things by budget accuracy


  • Top 15 things by product failure measurement


  • Top 15 things by weekly shipment variability


  • Top 15 things by admin and sales cost


  • Top 15 things by customer feedback


  • Things where sales exceeded 190% of budget


And so on – just think of the questions you have asked of your data in the past.


You cannot change cycle group choices through a list box or multibox. I have at times included a small chart with the cycle group as the dimension and a single expression just to give the report user a place to click on the cycle group icon. The expression consists of a single character: 1. The expression column totals are set to sum-of-rows and the chart is configured to limit the number of rows so that only the totals row is showing. The total for the one expression then is a count of the cycle group things. When the cycle group choice is customer then the expression total is a count of distinct customers. I use cycle group in the expression title too:


=GetCurrentField(xgroup)&' Count'


* * *

Sunday, February 12, 2012

Expression Overview - Find/Replace


The desktop QlikView Expression Overview is a useful tool for searching expressions in a document or doing a Find/Replace on terms and values in the expressions (from the desktop menu Settings->Expression Overview). Many people put expressions or parts of expressions into document variables mainly so that they have only one thing to change when the expression needs to change instead of changing individual expressions in multiple places in a document. With the Find/Replace functionality you can accomplish the same thing: make the change in only one place and effect the changes wherever needed throughout the document.

If you use text expressions for column labels and object titles then the Find/Replace function can change those too. Find/Replace will also change text in the expression comments; something I find useful since comments often refer to field names and function names. Some people put a little label or tag in a comment line in the expression to help them find those specific expressions later. For example, you might put a comment in the expression that looks like this, /* Tushar, please review this */ to help a quality review person find the expressions that need to be reviewed. (To make a comment in the expression either put /* before the comment and */ after the comment, or, use // to indicate that the remainder of the line is a comment.)

One thing to remember is that the Find or Find/Replace will not find hidden objects. When I am using Find/Replace functionality on a document with hidden objects I usually change the document properties Security tab and click on Show All Sheets and Objects. Then, Find/Replace can make a change to all expressions, even those on the hidden objects. After making the change, update the Security tab again to uncheck the Show All Sheets and Objects box.

If you want Find/Replace to avoid changing expressions in a particular object then you can temporarily hide the object while making the Find/Replace changes. To temporarily hide an object go the object properties and type 0 into the Show Condition (type a zero character). After the Find/Replace changes are finished, go to Document Properties, Security tab and click the Show All Sheets and Objects check box. Then, find your object and clear the Show Condition box in object properties. Go back to the Security tab and uncheck Show All Sheets and Objects and your temporarily hidden objects are visible again.


* * *

Wednesday, January 14, 2009

Load a Table With All of the Values for a Field

An idea for developers of large reports--

Sometimes in the loadscript you need to build a table that contains all of the previously loaded values from the tables that have already been loaded. This situation comes up when a concatenated key has been used in the tables. For example, you might have a report that loads data into several tables from different sources but you’ve loaded each of the tables so that it has a key field comprised of product_code, customer_number, ship_location, and ship_date; all concatenated together but separated with an underscore character. This technique is sometimes used in large reports in order to reduce memory requirements by minimizing the number of synthetic keys that QlikView must create. Each of the large tables shares only one field, the concatenated key field, instead of sharing multiple fields and causing QlikView to build the synthetic keys.

At the bottom of the loadscript you must collect all of the concatenated key values and explode them into the individual fields so that QlikView can build the associations. If the concatenated key from our example is named CCKEY then code like this would load all of the existing CCKEY values:

ALL_CCKEY_TABLE:
Load
FieldValue('CCKEY',IterNo()) as CCKEY
AutoGenerate(1)
While not Isnull(FieldValue('CCKEY',IterNo()));

That will create a table of all CCKEY values. Now add the part that splits out the fields based on the underscore separator character:

Left join load
CCKEY,
subfield(CCKEY,'_',1) as product_code,
subfield(CCKEY,'_',2) as customer_number,
subfield(CCKEY,'_',3) as ship_location,
subfield(CCKEY,'_',4) as ship_date
Resident ALL_CCKEY_TABLE;

A table like this loads very fast since all of the data is already available in memory.

Saturday, September 20, 2008

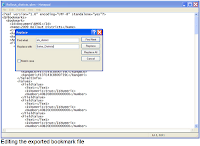
Fixing the Field Name in an Exported Bookmark File

Last month, I wrote about how useful bookmarks are because they can be exported as a file and then imported into different QlikView reports (Click here to read it). A problem you might run into from time to time is trying to use a bookmark file where the field name in the original report is different from the field name in the report where you want to import the bookmark. It's the same data but perhaps the field name in the original report was spelled differently. This kind of thing happens all the time when data is loaded into QlikView from spreadsheets. You can edit the bookmark file to fix that problem.

Here's an example:
Imagine that your co-worker, Kavya, in the Finance department has a QlikView report with all of the sales districts selected that will be used for the new product rollout. You could really use that bookmark for your project. She makes a bookmark of the selection and exports it and emails you the bookmark file, named Rollout_districts.qbm. But, after you import the file and click the bookmark name and nothing is selected, you discover that Kavya named the field in her report sls_district and in your report it is named Sales_Districts. If either Kavya's report or your report could easily be reloaded then you might be able to fix the field name during the reload - OR - you can quickly edit the field name in the bookmark file and make it usable.
Find the file (in this example, Rollout_districts.qbm) in Windows Explorer. Right-click on the file and select Open With->Notepad. The bookmark file is a kind of text data known as XML. It's ok if you never heard of XML; you don't need to know anything about it for this process. In the Notepad window select Edit->Replace... and when the Replace window opens type sls_district in the Find What: field box and type Sales_Districts in the Replace With: box (*See the diagram at the top of this posting - click on it for a better view). Now, click the Replace All button and then click Cancel to close the Replace window. Click File->Save As and save the bookmark file under a different name (just in case you need the original file again). Don't edit or change anything else in the bookmark file. Finally, import the new bookmark file into your report and you'll have the selections just as you wanted.

For this process to work the way you want, of course, it must be the same kind of data in the fields in both the original report and the report being edited. You can't change a bookmark file of country names into a bookmark for movie titles just by editing the field name.

Saturday, August 23, 2008

Field names and compressing data

One of the cool things about QlikView is the way it can store enormous amounts of data in the report file. It can load many millions of rows of data into a report file that might only be one or two MB in size. It compresses data so well that I seldom zip a report file before sharing it since the data is stored so densely in the QV report that zipping the file doesn't give much of a savings. If you are working with loading very large tables into a report be aware that part of the QV strategy for compressing data depends on not actually storing duplicate values in a field. If the report loads sales order data, for example, and the data contains customer name then there may be many duplicate values in the data for any customer who has ordered many times. QV will only store the customer name once and then keep track of where that customer name is used again as subsequent rows are loaded.

This mechanism means that if you load two different tables from your database that contain customer name into two different QV tables and if the field name is the same for both QV tables then each customer name value is only stored once. But, if you give the field a different name in each QV table then the program cannot know that it is the same data and it must treat each field separately and many customer name values will be stored twice. This is really only a consideration when working with enormous tables where the sheer size of the tables is affecting memory utilization of the report or the size of the report file.

Remember that QV relates or joins the tables together based on the fields they have in common. Two QV tables that both contain the field Customer_Name will be related based on that field. So, sometimes making the field names in the tables the same to be more efficient with memory utilization will not be possible if it causes two tables to be joined when they shouldn’t (the joining of tables also consumes memory space). And the field names should only be the same if the field data is truly the same. Customer number from your company’s database is not the same as customer number from another company’s database. But, customer number from your company’s 2006 sales data is probably the same as customer number from the 2007 sales data.

Wednesday, August 20, 2008

More you can do with Partial Reload

See the previous posting about removing tables. In the same way that you can enter a Drop Table command to remove a QlikView table from an existing report, you can enter these commands which will affect the existing report already loaded with data:
  • To remove a field from every QlikView table in which it appears, enter Drop Column;
    For example, for privacy reasons you might want to get rid of social security number data in your report before sharing it with your team. You might enter:
    Drop Field Customer_SSN;

  • To remove a field from specific table(s), for example, you might enter:
    Drop Fields Customer_Name, Customer_SSN from CUST_MSTR_TABLE, ORDER_HDR_TBL;

  • To change the name of a column or field in every table in which it appears enter Rename Field; (remember that the field names are how QlikView relates or "joins" the tables together so this one affects that table relationship).
    For example, you might enter:
    Rename Field domestic_custno to North_America_Customer;

  • You can change the name of an existing table. For example, you might enter:
    Rename table domestic_sales to North_America_Sales;

All of these commands can also be used in the loadscript during a normal load but they can be especially useful for fixing issues when used with an existing report that is already loaded with data. Remember to put them at the top of the loadscript, add an Exit Script; command and then execute the commands with the Partial Reload. The rename commands can be used with a mapping table if you think you might need more powerful renaming capabilities. Refer to the Help Text or Reference Manual for info about how to use a mapping table for renaming fields and tables.